Stock Pullbacks Are Helpful, Not Hurtful
Warren Buffett Says Don’t Mix Politics and Investing
Stock prices see pullbacks several times during the year. It is a normal, healthy part of the investing cycle. Is it unsettling? Very! But when prices turn volatile, remember “been there, done that.”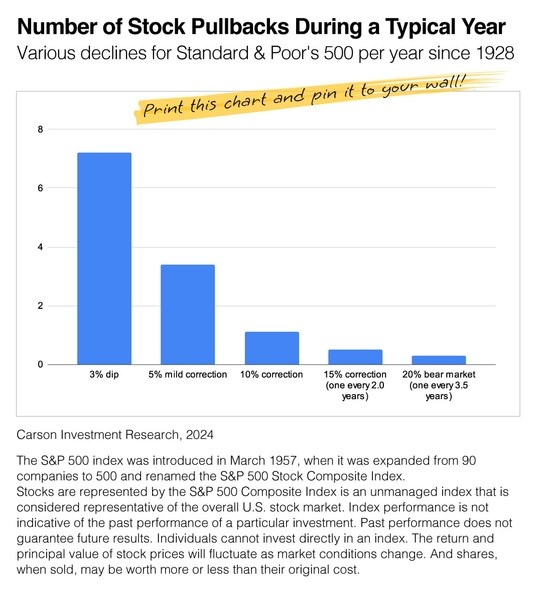 The second half of February was difficult for investors–and the first part of March was not much better either. There were waves of news about tariffs, inflation, economic growth and geopolitical events.
But was the selling unexpected? Not really. Since 1950, history shows that in post-election years, February has been the worst month for stock prices. (Spoiler alert: Post-1950, June, August and September also show poorly in post-election years. So mark your calendar.)
It’s important to remember that past performance does not guarantee future results. Stock prices will fluctuate as market conditions change. So, while we can look to history for trends, it’s uncertain how the rest of 2025 will unfold.
Sources: Carson Investment Research, Feb. 5, 2024
Market Insights
Investors endured another volatile, whipsaw week as ongoing trade talks and White House comments about the economy unsettled investors.
The Standard & Poor’s 500 Index declined 2.27 percent, while the Nasdaq Composite Index dropped 2.43 percent. The Dow Jones Industrial Average fell 3.07 percent. The MSCI EAFE Index, which tracks developed overseas stock markets, lost 0.95 percent.
Markets Stem Losses
Stocks opened the week lower as investors reacted to the president’s weekend comments about the economy. Then, U.S. and Canadian leaders traded additional tariff threats, riling up anxious investors.
Stocks rebounded midweek after a cooler-than-expected Consumer Price Index (CPI) report eased growing inflation concerns. The broad market slide resumed Thursday, but better-than-expected February wholesale inflation data helped buffer losses. The S&P 500 ended Thursday in correction territory—10 percent below its Feb. 19 record close.
Markets pushed higher Friday, clawing back some losses for the week. News of progress in resolving the federal government shutdown soothed investors’ nerves.
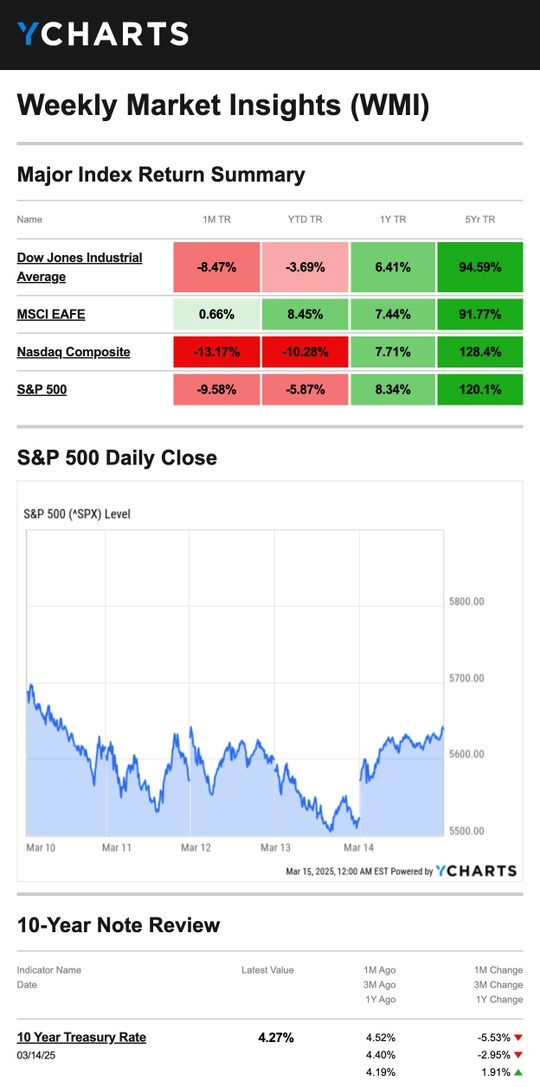
Source: YCharts.com, March 15, 2025. Weekly performance is measured from Monday, March 10 to Friday, March 14.
TR = total return for the index, which includes any dividends as well as any other cash distributions during the period. Treasury note yield is expressed in basis points.
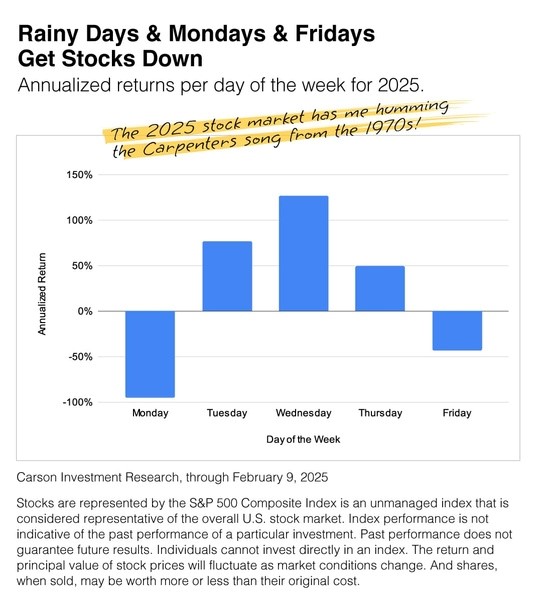
Rainy Days & Mondays (& Fridays) Gets Stocks Down
As the chart shows, Mondays and Fridays have been awful for investors, while the mid-week days have performed better. (The final Friday of February was the exception.)
So far this year, Mondays have had an unsettling tariff update in early January, followed by the AI news about a Chinese competitor with a low-cost model. By Friday, the chart shows that some are opting to move to a “risk off” position as the weekend draws closer. Given Monday’s 2025 history, you can’t blame traders for flinching on Friday.
It’s an important reminder that past performance does not guarantee future results. Stock prices will fluctuate as market conditions change. So, in three months, this chart could look completely different. However, the illustration shows how whimsical the stock market can be when you view a small sample size of trading.
“I would tell [investors], don’t watch the market closely,” was the time-test guidance offered by Warren Buffett, who knows a thing or two about investing.
So, if you find yourself getting a bit overwhelmed by the financial markets’ price action this year, please give Adams Brown Wealth Consultants a call. We can revisit your portfolio strategy and see if an adjustment might help you feel more comfortable.
Source: Carson Investment Research, through Feb. 9, 2025